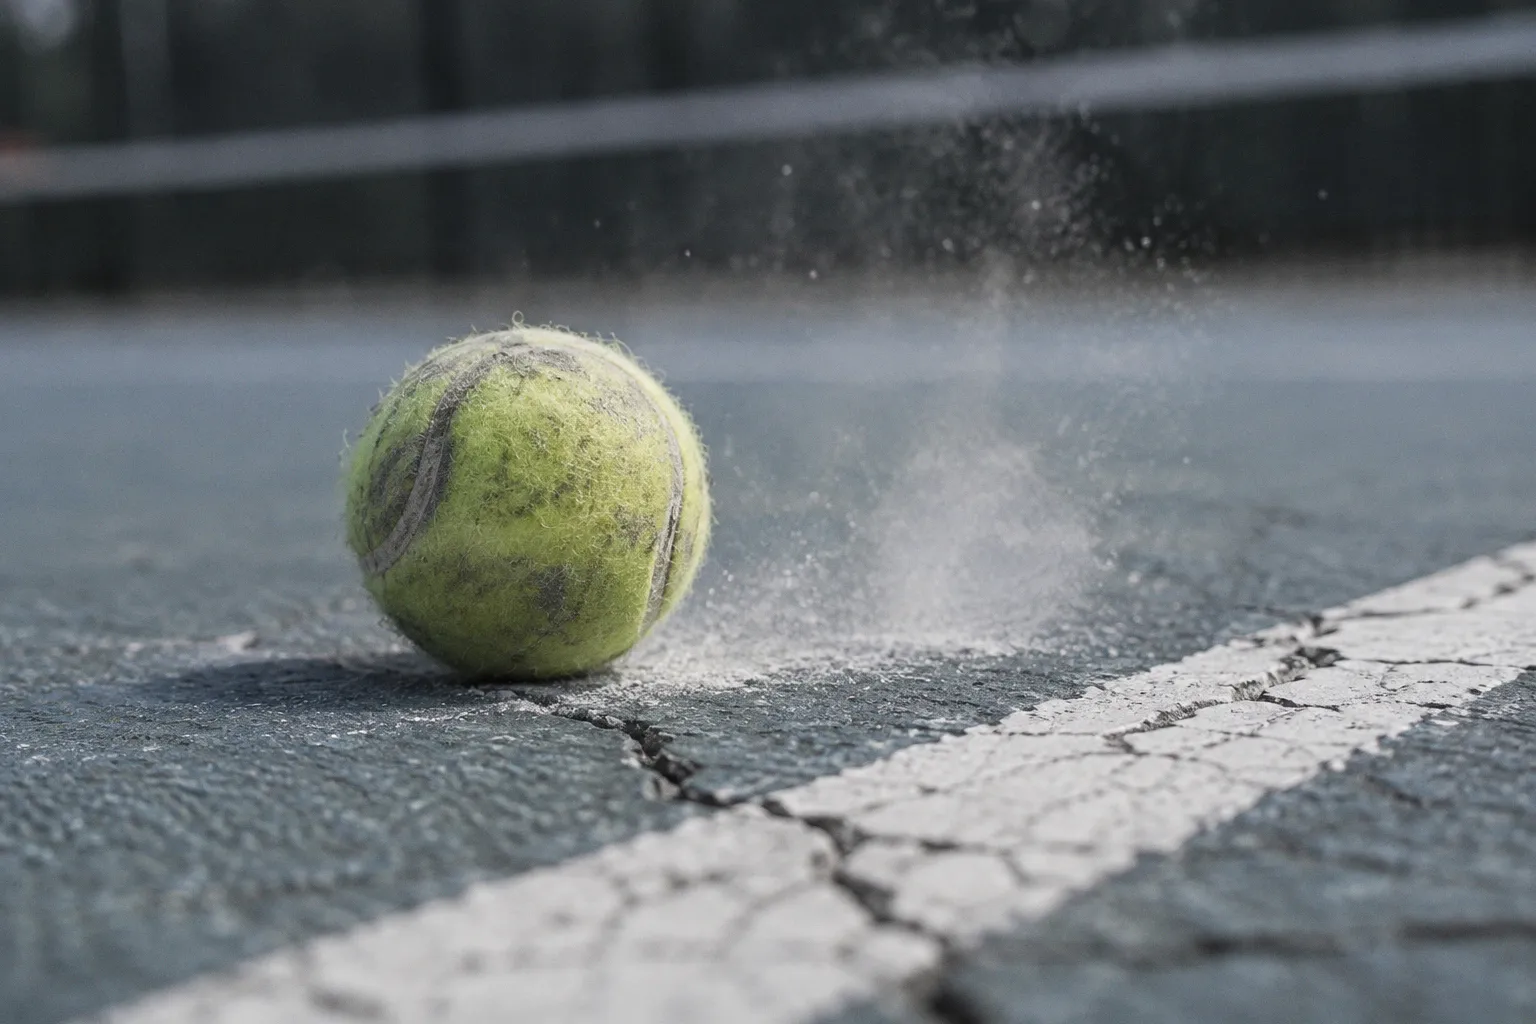
Cincinnati splits the difference because the hard courts sit somewhere in the middle. The narrator nods, the camera cuts to a wide shot of the surface, and everyone moves on without checking whether the numbers behind the thesis actually hold up. They usually don't, at least not in the form the broadcast leaves you with.
Surface speed is real. It shapes how points start, how servers operate, and what kind of error economy the court permits. But the claim that the bounce and friction profile of the playing surface dictates rally length — that this is the master variable, the one knob the tour turns to control the spectacle — that claim deserves to be interrogated rather than repeated. And the data, when you finally go looking for it, tells a more conditional and frankly more interesting story than the conventional wisdom has been selling.
The myth of the surface-length correlation
The conventional story runs like this: slower courts stretch points because the ball grips and bounces higher, giving defenders more time. Faster courts compress points because the ball skids through, rewarding big serves and short swings. It is intuitive. It is also deterministic in a way the sport almost never is.
Look at any major swing — Madrid to Paris to London to North America — and the surface narrative gets used to explain almost everything. A grinder wins Madrid? Slow court. A big server wins Halle? Fast grass. A baseliner finally breaks through at the US Open? The talking heads tell you the courts are playing slower this year. The story is always ready, and it is almost always lazy. Who, exactly, is doing the dictating — the surface, or the player who happens to be standing on it?
The surface is a stage, not a script. Players still have to write the scene, and most of them arrive with their own vocabulary.
What the stage metaphor misses is that the same court can host an 83-shot rally and a one-shot point on the same afternoon, depending on who is holding the racquet. If surface speed dictated rally length with anything close to the force the conventional wisdom implies, that range would collapse. It doesn't. It can't, because the players are doing most of the work, and the players are not a constant.
Deconstructing the ITF Court Pace Rating system
Before going further, it helps to understand what surface speed actually means in a measurable sense. The International Tennis Federation classifies court pace using a Court Pace Rating, a number derived from how fast the ball travels before and after the bounce. Friction — how much horizontal speed the surface bleeds off — is built into the measurement, as is bounce height, because higher-bouncing surfaces tend to score slower for an obvious reason: the ball climbs above knee height and the player has more time to track it.
The ITF then sorts courts into five categories. The bands look like this:
| Category | Pace label | Court Pace Rating |
|---|---|---|
| 1 | Slow | ≤ 29 |
| 2 | Medium-slow | 30–34 |
| 3 | Medium | 35–39 |
| 4 | Medium-fast | 40–44 |
| 5 | Fast | ≥ 45 |
Two things are worth noting before anyone starts quoting these numbers as gospel. First, a Court Pace Rating is a measurement of the court, not of the tournament. Madrid's Caja Mágica and Rome's Foro Italico are both clay, but they are not the same surface, and they do not return the same pace rating. Second, the rating describes a baseline. It says nothing about altitude, ball type, indoor humidity, or whether the roof is closed, all of which can shift how the surface actually plays on a given afternoon.
In other words, the ITF system is a useful diagnostic instrument, not a destiny machine. It tells you the friction and bounce profile of the slab under your feet. It does not tell you what the men and women standing on it will do with the next ball.
Statistical reality: what 750,000 points reveal about rally duration
The cleanest window into the surface-rally question is a large dataset, and the largest recent one was published in 2024. Researchers pulled shot-by-shot data from the Match Charting Project covering professional matches played since 2000 — 503,946 points from 5,751 men's matches and 247,389 points from 3,431 women's matches. For a question about rally length, that is enough volume to stop arguing from anecdote.
The headline findings are easy to summarize. In the men's sample, the mean rally length was 4.3 shots on clay, 3.8 on hard courts, and 3.2 on grass. In the women's sample, the comparable figures were 4.2 on clay, 3.9 on hard, and 3.5 on grass. The medians were flatter still — three shots on clay for both genders, two for men on hard and grass, three for women on every surface.
| Surface | Men's mean rally | Women's mean rally | Men's median | Women's median |
|---|---|---|---|---|
| Clay | 4.3 shots | 4.2 shots | 3 | 3 |
| Hard | 3.8 shots | 3.9 shots | 2 | 3 |
| Grass | 3.2 shots | 3.5 shots | 2 | 3 |
The pattern exists. It is not nothing. But notice the size of it. The gap between men's clay and men's grass — the two ends of the surface spectrum — is just over one shot on average. The same gap for women is roughly 0.7 shots. If surface speed were truly dictating rally length, you would expect a wider separation than that. You would expect a chasm. What you get instead is a gradient, and gradients get explained by more than one variable at a time.
Where the surface signal does get louder is in the tails of the distribution. Rallies lasting more than 15 shots occurred in 2.6% of clay points in the men's sample, 2.3% on hard, and 1.1% on grass. The longest rallies observed in the entire dataset were 83 shots on clay, 59 on hard, and 48 on grass. So clay does stretch the extreme — that part of the conventional story survives scrutiny.
But look at the other end. One-shot points — aces and service winners, essentially — made up 35.6% of grass-court points in the men's sample, 30.9% on hard, and 24.0% on clay. The surface is doing real work at the fast extreme, and modest work at the slow extreme. What it is not doing is rewriting the middle of the distribution, which is where the bulk of professional tennis actually lives.
Clay does not produce long rallies so much as it permits them. Fast courts do not kill them so much as decline to host them.
That distinction matters. Surface speed sets the ceiling and the floor of what is possible on a given afternoon. It does not, by itself, decide how often players approach either.
Beyond friction: the variables that actually shape a point
If surface speed is not the master variable, what is? The 2024 study ran statistical models against the same dataset to test which factors actually drove rally length. The single most influential variable it identified was not surface. It was player height. Taller players, both men and women, tend to win their service points with fewer shots and dominate shorter rallies, which compresses averages and reshapes distributions in ways that have nothing to do with the slab underneath.
After height, the next layer of variables is familiar to anyone who watches the tour closely. Serve effectiveness — first-serve percentage, ace rate, the share of service points won in under four shots — does far more work than the pace rating of the court. So do ball characteristics (the extra bite of a brand-new can versus the felted-up mush of one that has been in the press all day), weather (humidity, wind, air density at altitude), and the tactical context of the match itself. A tiebreak produces different tennis than a routine hold. A deciding set produces different tennis than either. None of that is captured by a Court Pace Rating.
There is also a measurement convention that the broadcast conversation almost never mentions. In the 2024 study, the serve counts as a shot. A double fault counts as zero shots. An ace or an unreturned serve counts as one shot. Errors do not extend the rally count. That convention is standard, but it means the rally-length distributions in the dataset are pre-filtered by serve effectiveness, which is a player variable, not a surface variable. So even the cleanest surface comparison is partly a serve comparison dressed up as a bounce comparison.
Layer all of that onto the surface and the picture gets crowded. Surface speed is one input among several, and not always the loudest. A slow court with two big servers can produce shorter rallies than a medium-fast court with two counterpunchers. The dynamics of the match — who is hitting, what they prefer, how nervous they are, how the scoreline is bending their decisions in real time — carry at least as much weight as what the ITF measures about the slab.
It is also worth flagging what the dataset is and isn't. The Match Charting Project is crowdsourced. It contains an enormous number of matches, but it does not contain every professional match from the period, so its surface averages should be read as a strong sample rather than a complete census. Anyone telling you the numbers are gospel is overplaying a method that is rigorous but partial.
The diminishing returns of surface speed in modern tennis
So where does this leave the surface-rally question? Not where the broadcast desks leave it, and not where the marketing departments of tournaments would like it to sit. Surface speed remains a real, measurable input into how a point unfolds. The 2024 dataset confirms a clean gradient from grass to hard to clay in mean rally length, and it confirms that clay stretches the right tail of the distribution while grass loads the left tail.
But the surface does not dictate rally length. It permits, restricts, and nudges. The bulk of the variation comes from players — their height, their serve profile, their tactical preferences, their state of mind under pressure — and from a handful of contextual variables that no Court Pace Rating can capture. The pattern in the data is not a single-variable story. It never was.
This matters because the modern tour has spent roughly two decades quietly homogenizing playing conditions. Indoor hard courts. Climate-controlled venues. Ball consistency from week to week. Altitude managed where it can be managed. Serve-friendly surfaces as a default rather than an exception. The result is not that surface speed has disappeared; the result is that its variance across the calendar has shrunk, and so its explanatory power has shrunk with it. In a tour where Madrid, Montreal, and Cincinnati are all variations on a theme, the surface narrative gets thinner every season. The Court Pace Rating still tells you something, just less than it used to.
The honest version of the story is also the more interesting one. Tennis points are not short because the grass is fast. They are short because someone hit a serve the returner could not touch. They are long because two players refused to miss for twenty strokes, on whatever surface happened to be under their feet. The court sets the conditions. The players write the match. Anyone telling you the surface dictated the result is selling you a simpler sport than the one being played — and a less truthful one.